|
39.8 Grid View |
  
|
|
39.8 Grid View |
|
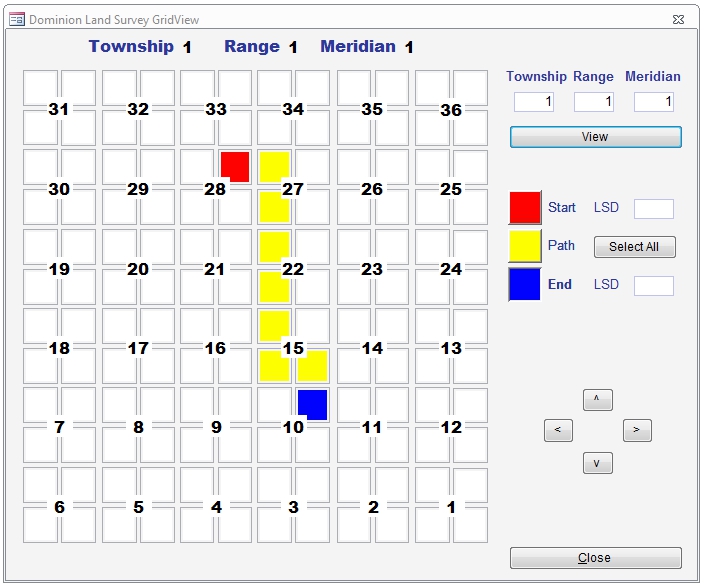
39.8.1 This is a sample grid view of the legal descriptions on a site using the Dominion Land Survey grid system. It allows you to visualize where your legal descriptions are located and connected.

To display a legal description on the grid view, select from the options below:
Start - is the beginning legal description. There can only be one on each job.
End - is the ending legal description. There can only be one on each job.
Path - connects legal descriptions from the Start to End
Supported grid systems are: Dominion Land Survey (DLS) and National Topographic System (NTS)
39.8.2 Dominion Land Survey (DLS (sometimes called as ATS - Alberta Township System or simply Township system))
For this to work, set the legal description (ie. txtLDF*) custom field text to use the exact values below:
LSD - legal subdivision
Quarter - quarter or quadrant
Section
Township
Range
Meridian
To use the Grid View:
1) In the Site tab, click the 'Dominion Land Survey GridView' button.
2) Enter Township, Range and Meridian.
3) Click View.
4) Click the Start button (red).
5) Click the Quadrant you want to plot.
6) Click the Path button (yellow).
7) Click the Quadrant you want to plot.
8) Click th End button (blue).
9) Click the Quadrant you want to plot.
10) Click Close to save.
39.8.3 National Topographic System (NTS)
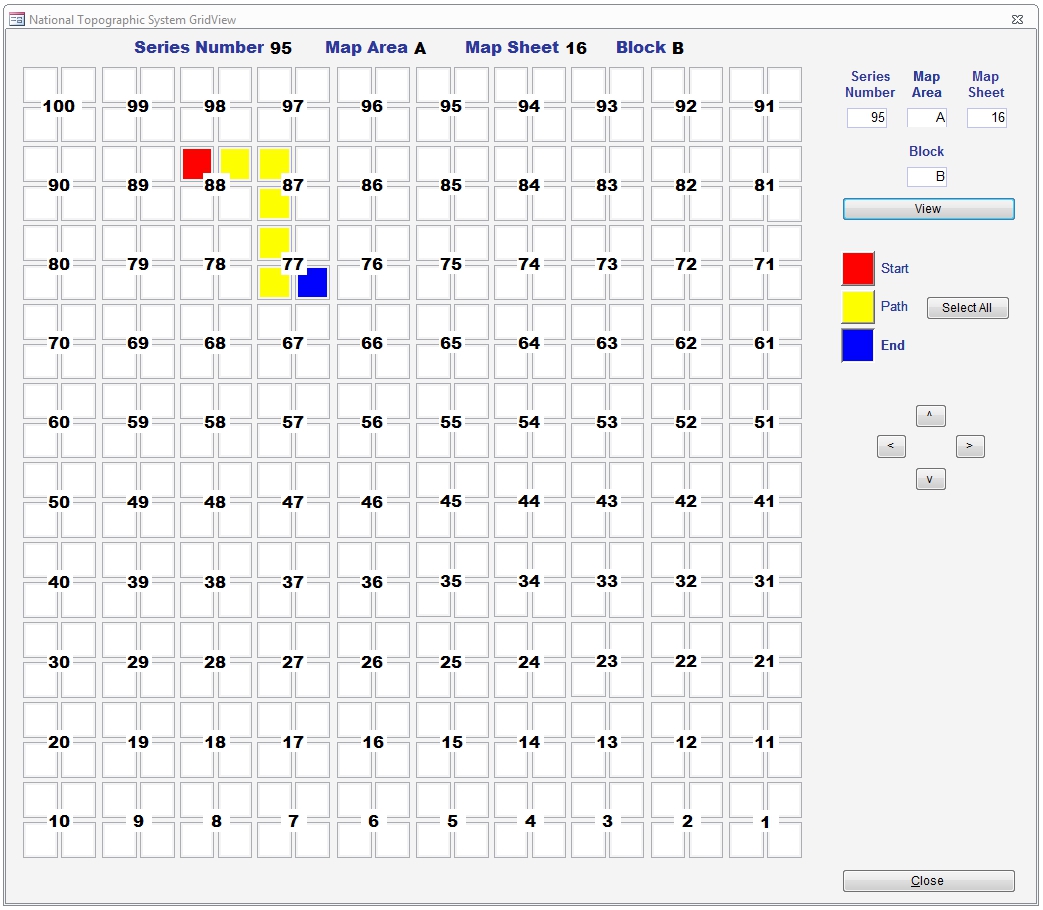
For this to work, set the legal description (ie. txtLDF*) custom field text to use the exact values below:
Quarter Unit
Unit
Block
Map Sheet
Map Area
Series Number
To use the Grid View:
1) In the Site tab, click the 'National Topographic System GridView' button.
2) Enter Series Number, Map Area, Map Sheet and Block.
3) Click View.
4) Click the Start button (red).
5) Click the Quarter Unit you want to plot.
6) Click th Path button (yellow).
7) Click the Quarter Unit you want to plot.
8) Click th End button (blue).
9) Click the Quarter Unit you want to plot.
10) Click Close to save.

)
)